Semiconductor Target TCO Analysis: Boosting Utilization by 30% via Design & Bonding
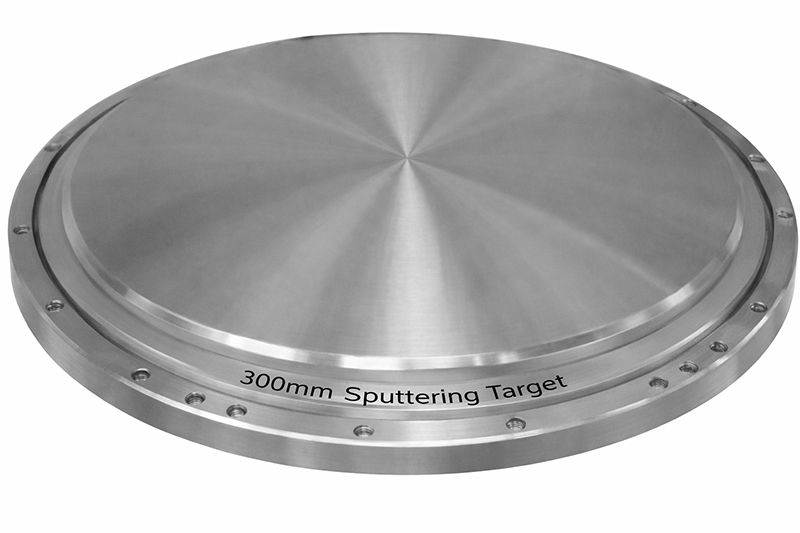
Abstract: In semiconductor manufacturing, the cost of a PVD sputtering target extends far beyond its purchase price. For 300mm targets, low utilization rates and unscheduled downtime due to bonding failures represent massive, hidden costs. This article provides a Total Cost of Ownership framework, demonstrating how strategic target design (rotary vs. planar, asymmetric erosion profiles) and advanced bonding technology can increase material utilization to 80% or higher and prevent catastrophic failures. We quantify the return on investment through reduced target consumption, minimized tool downtime, and predictable maintenance cycles.
The Real Cost: Beyond the Price per Kilogram
A 300mm sputtering target is a significant capital expenditure. However, focusing solely on its initial cost is a critical financial oversight. The true expense lies in two often-overlooked areas:
-
Inherent Material Waste: A standard planar target in a conventional magnetron may see only 30-40% of its material consumed before erosion grooves become too deep, creating arcing risks and film non-uniformity that force its replacement. The remaining 60-70% is scrap.
-
The High Cost of Unplanned Downtime: A target bond failure—where the target separates from its cooling backplate—doesn’t just ruin the target. It causes an immediate process chamber shutdown, requires a full clean to remove contaminants, and leads to hours of lost production time. In a high-volume fab, this can translate to hundreds of thousands of dollars in lost revenue per incident.
The goal shifts from buying the cheapest target to maximizing the usable material per target and guaranteeing its reliable operation throughout its entire designed life. This is the core of Total Cost of Ownership.
Design Optimization: Engineering the Erosion Path
The first lever for cost control is geometric design, which dictates how the plasma erodes the target material.
-
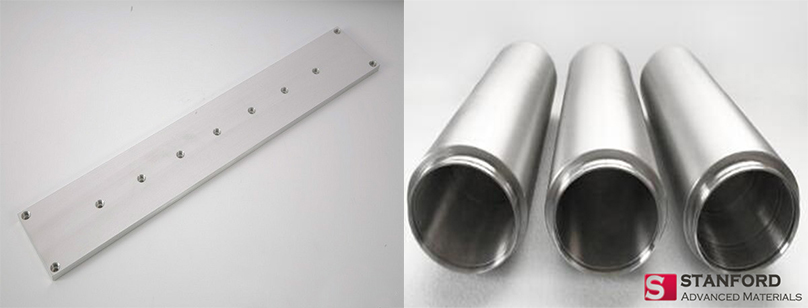
Planar vs. Rotary Targets: A Utilization Revolution
-
Planar Target: The classic design. The plasma erodes a localized “racetrack,” leaving thick edges unused. Typical utilization: 30-50%.
-
Rotary Target (Cylindrical): The target rotates, presenting its entire cylindrical surface to the plasma. Erosion is distributed uniformly around the circumference. Typical utilization: 70-85% or higher.
-
Decision Impact: Switching to a rotary design can effectively halve the number of targets consumed per year for a given process. The ROI calculation must include any necessary chamber modification but is almost always positive for high-volume, long-run processes.
-
-
Asymmetric & Contoured Designs: For planar targets where rotary is not feasible, advanced modeling can create non-uniform thickness profiles or contoured surfaces. These designs anticipate and compensate for the natural erosion pattern of a specific process, flattening the erosion profile and extending usable life, pushing utilization toward the 50-60% range.
Bonding Technology: The Invisible Lifeline
The bond interface between the target material and the copper/ aluminum backplate is the most critical reliability factor. It must be perfect: any void is a hot spot, and delamination is a total failure.
| Bonding Method | Thermal Conductivity | Mechanical Strength & Fatigue Resistance | Key Risk & Typical Life Indicator |
|---|---|---|---|
| Solder/Indium Bonding | Good | Low to Moderate. Prone to creep and thermal fatigue. | Fatigue failure after thermal cycles. Life is highly variable. Common in low-power applications. |
| Conductive Epoxy | Poor | Low. Degrades at elevated temperature. | Overheating and charring, leading to arcing. Not suitable for high-power semiconductor processes. |
| Advanced Diffusion Bonding (e.g., SAM’s process) | Excellent (near-parent metal) | Very High. Forms a metallurgical bond. | Minimal. Predictable life. Designed for high power density. |
Case in Point: A logic fab running a high-power copper interconnect process experienced recurring target failures at ~300 kWh. The bond was the weak link. By switching to targets featuring an optimized high-temperature diffusion bond, the mean time between failures (MTBF) increased to 550 kWh. This extended target life by over 80%, directly reducing the target cost per wafer and eliminating several unplanned downtime events per target.
From Reactive to Predictive: Monitoring and ROI Calculation
Maximizing TCO requires moving from calendar-based changes to condition-based maintenance.
-
Predictive Monitoring: By tracking process parameters (arc counts, power stability) and directly monitoring backplate temperature, engineers can model the remaining target life. This allows for replacement during planned maintenance windows, eliminating surprise failures.
-
The TCO Calculation Model: A comprehensive analysis must include:
- A. Direct Target Cost: (Purchase Price per Target) / (Usable kWh per Target).
- B. Cost of Ownership per kWh: Includes inventory carrying costs, disposal costs, and labor for changeouts.
- C. Downtime Risk Cost: (Probability of Failure) x (Cost of Unplanned Downtime).
- D. Process Yield Impact: Cost of film non-uniformity or particles from a worn target.
-
Formula: Total Cost of Ownership = A + B + C + D
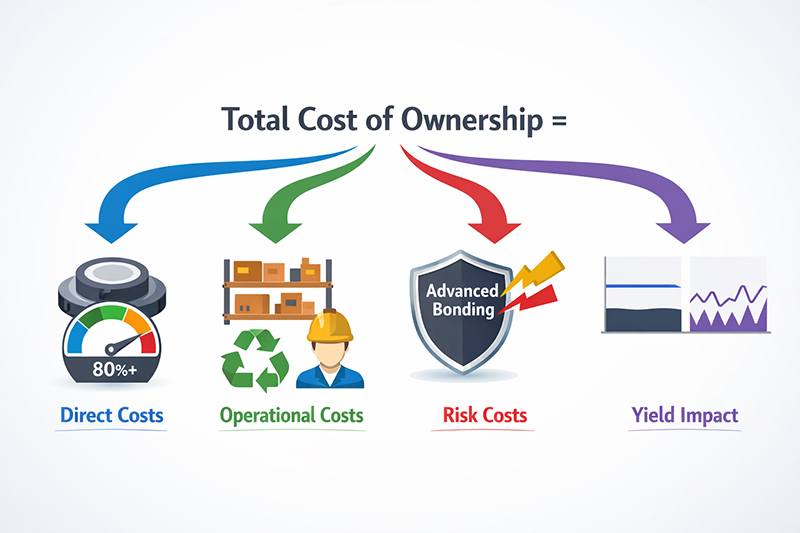
An advanced design with superior bonding dramatically improves A (more kWh per target), minimizes C (near-zero risk of bond failure), and stabilizes D. While its unit price may be higher, its TCO is invariably lower.
Conclusion: Redefining Target Procurement
In the competitive landscape of semiconductor manufacturing, cost leadership comes from optimizing every variable. Sputtering targets, once seen as simple consumables, are now recognized as complex engineered components whose design and integration directly impact the bottom line.
Investing in targets designed for high utilization and bonded for maximum reliability is not an expense—it’s a strategic cost-saving measure. It transforms a significant and variable cost center into a predictable, optimized part of the production flow.
Is your target strategy optimized for Total Cost of Ownership?
Contact SAM’s engineering service team. We will analyze your current process data, target consumption, and failure modes to provide a detailed TCO report and a roadmap for achieving utilization rates of 80% or higher.


